Notice for Internet Explorer users: Click here regarding fix for website display.
Overview
The constituency dashboards contain 28 distinct census indicators split into six themes. Each theme has a number of these indicators; distinct dashboards showing data from one particular aspect of that theme, e.g. a constituency's population by their principal economic status under the Economic Status & Work Theme.
Get a printable version of this page.
List of indicators
Please click here for a list of all the themes and their associated census indicators.
Worked example
If you would like to see a full example of using the dashboards to answer an query please click here.
Below is a reference to the key functionality only
Navigating
When you visit the dashboards at first, you will see the landing page. From here you can select your constituency of interest (or leave defaulted to Carlow-Kilkenny) and then dive into any theme of your choosing by pressing any of the large theme icons.

Another way to navigate between dashboards is to use the side-bar menu on the left-hand side.
From here, you can select a theme at any time to see what other indicators are accessible. You can open multiple themes here simultaneously while deciding what to visit next. By selecting any, your current page will update to show the new indicator dashboards.
Alternatively, you can right click the menu item and choose ‘Open in new tab’ to keep your current dashboard active and open a second tab in your internet browser.
Dashboard layout
Each dashboard shares a similar layout and usually comprises of:
- A map section,
- An individual ED section, and
- An aggregate ED section.

Configuring the map
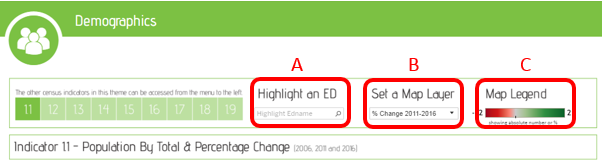
Constituencies are comprised of many Electoral Divisions or EDs. If you know the name of an ED, but can’t quite find it, you can enter the name in the ‘Highlight and ED’ box (A) and it will light up on the map. You can then hover over this ED to see info (as per the pre-set map-layer) or click on it to tailor the charts below the map.
The map shows a coloured representation of EDs across the constituency matching a pre-set ‘Map Layer’. The map layers can be changed by clicking on the dropdown box shown in B and the map will update to reflect the change of data. The range can be seen in the ‘Map Legend’ in C.
Using the Map
The map can be used in many ways and as noted above (B), the map layers can be changed to display different data for the same indicator.

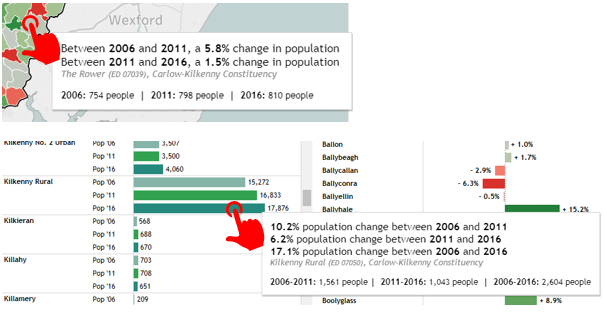
You can hover over EDs to see tooltip information relating to the current map layer.
You can left-click on an ED to select it – doing so will change all of the charts further down the page; they will only show data for that ED.
You can select multiple EDs individually by ctrl + left-clicking in succession. Each click will add an ED and the map and charts will update. You can build your own catchment areas of interest this way instead of just taking the total constituency.
Individual selection can take time in large constituencies; so there are map controls to make this much faster (below).
To unselect click anywhere outside the ED map of the constituency (panning the map if necessary if you have zoomed in). This will clear revert all the charts to the full constituency. Alternatively, refresh the page.
Map controls
The map controls appear in the top left of the map window whenever your mouse is on the map.
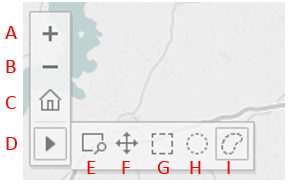
The various options are:
- Zoom in (+)
- Zoom out (-)
- Home: resets the map to the default zoom/position
- Click ► icon to view other map controls
- Area zoom
- Pan (move the map in any direction)
- Rectangular selection (of EDs)
- Radial selection
- Lasso selection (free hand drawing)
Other controls & functionality
A lot of information is to be found in the hover-over tooltips which display whenever your mouse is over an ED (on the map or in the charts).
At the bottom of each dashboard there are also undo, redo and reset buttons to undo selections or reset to the dashboard to its initial view. In most cases it is advisable to simply refresh the page by clicking F5 in your browser.
Download as PDF or image
At the bottom of the dashboard there is a download button. Click on the button and the following menu appears. This allows you to download the currently displaying dashboard as an image or a pdf.
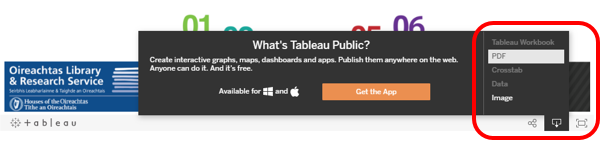
When downloading as a pdf you can select the whole dashboard or elements within it i.e. just the map or the charts. You can also select the layout and size of paper (A4 etc.) and change the scaling. You may need to configure this a little depending on your computer’s print settings.